Urban Planning / Geography

Spatial Analysis
& GIS

Tools for exploring thematic mapping, spatial overlays, proximity analysis, and suitability modeling — drawn from MIT, Carnegie Mellon, UT Austin, UNC, and UW curricula.

spatial analysisgeodatabasescartographic representationthematic mappingspatial overlaysnetwork analysisraster GISspatial interpolationsite suitability analysisurban data visualizationgeospatial database designproximity analysis
Exploration tools
01
Live

Neighborhood Explorer

Stack map layers. Run proximity analysis. Build a spatial intuition.

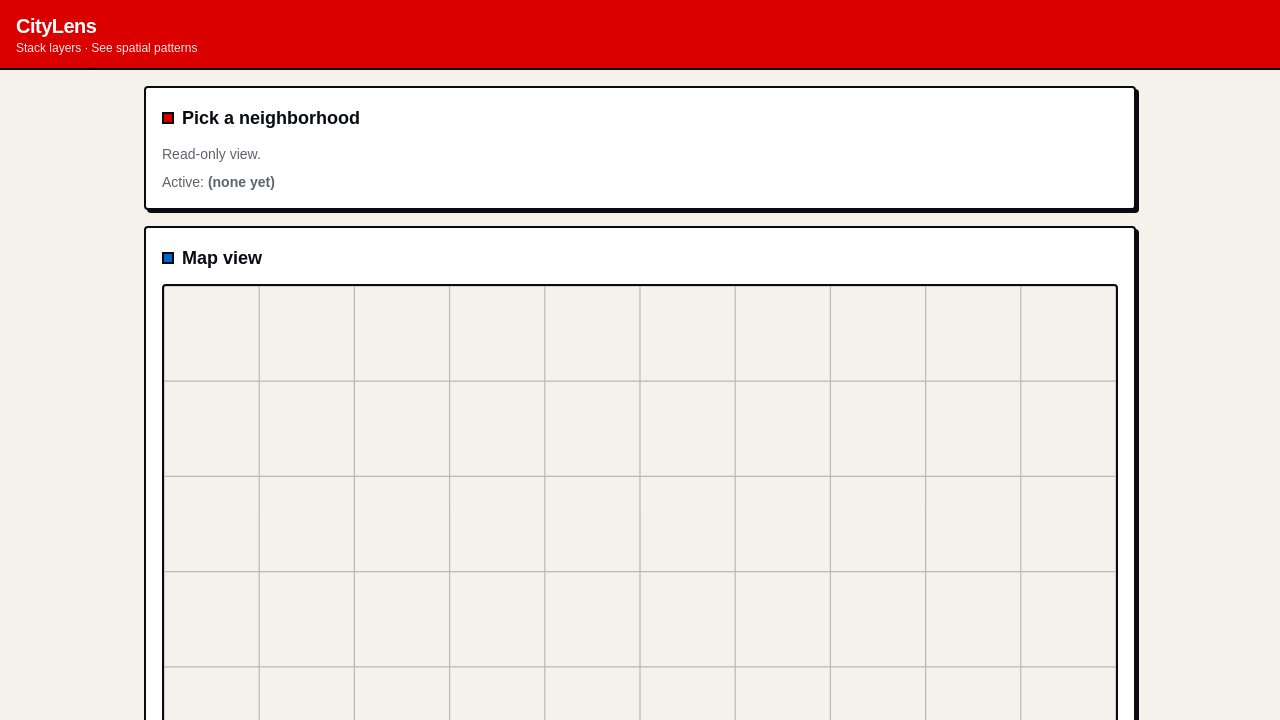
Explore why some neighborhoods feel walkable and others don't: stack thematic mapping layers (parks, transit, grocery stores, redlining boundaries), run proximity analysis with adjustable buffers, and try a simple site suitability analysis for a new branch library — all without a GIS software stack.
02
Live

Community Map

Drop a pin. Write up what you observe. Stitch the evidence into a council argument.

Map spatial evidence for a city council hearing: members drop pins on observed conditions, run network analysis for walk time changes under alternative transit routes, and produce cartographic representations the committee can hand to council members.

03
Live

Planning Workflow

Subdivision review, floodplain determination, hazard buffer check — templated and auditable.

Manage a county planning department's recurring spatial workflows: pull relevant geodatabases for each subdivision review, run standard spatial overlays, compute buffer compliance with proximity analysis, and generate consistent cartographic representation output — every determination versioned and traceable.

04
Live

Suitability Analysis

Weight the criteria. Build the surface. Compare equity-first vs. demand-first scenarios.

Select EV charging station locations across a metro area: define suitability criteria (corridor distance, grid capacity, equity priority, demand surface), score and weight each layer, compose the weighted raster GIS surface, and run sensitivity analysis to see which top candidates are robust vs. criterion-dependent.

05
Live

Disaster GIS Ops

Population to routes. Shelter capacity. Hazard footprint. Every decision timestamped.

Run mission-critical spatial analysis during active disaster events: proximity analysis of population to evacuation routes, network analysis for travel times under degraded conditions, site suitability analysis for shelter activation, and publish urban data visualization for residents — all with a full audit trail.

Make your own on vibes.diy →